Hardiness Zones Can be Confusing
Return to Environment articles.
By Dennis L. Patton, M.S., County Horticulture Agent, K-State Research and Extension/Johnson County
 Often efforts to make something new and improved really do not work. In fact, sometimes the old tried and true is the best approach. This can be said about efforts to update the plant hardiness zone map.
Plant Hardiness Zone Map — the standard used by the growing industry
The United States Department of Agriculture (USDA) first published a map in 1960 which assigned a zone to regions in the country showing how cold plant materials in that region could survive over winter. The map showed ten broad hardiness zones based on 10 degree F. gradients.
According to the Agricultural Research Service, their map is the standard by which gardeners and growers can determine which plants are most likely to thrive at a location. The USDA hardiness zone map became widely accepted in the plant world with just about every nursery tag indicating the range or zones in which the plant would grow based on winter temperatures. The USDA map was developed using historical weather data over a 50 to 100-year range to determine zone placement.
In 1990 the USDA updated their map to reflect the conditions at that time. It was a blend of the old weather data used to create the first map and weather patterns since the 1960s. Even at that time, to make the map more user-friendly, it became more complicated. It listed the original numbered zones, but added "a" and "b" subzones to account for north-south differences within a zone. The Kansas City area was always a zone 5 region. But under the 1990s revision, we fell into zone 5b, with winter lows of -10 to -15 degrees.
National Arbor Day Foundation releases their own zone map
In 2006 a hardiness zone map was released by the non-profit National Arbor Day Foundation. Their map was based on temperature data recorded during the late 1980s and 1990s. As you can imagine, their map revealed temperatures that were generally warmer. These temperature differences led to major changes for the Midwest. In 2023 the National Arbor Day Foundation map moved Kansas City to zone 6b, with winter low temperatures of 0 to -5 degrees.
Current hardiness zone maps
Both organizations again updated their maps: the USDA in 2012, and the Arbor Day Foundation in 2015. In both maps, the Kansas City area is firmly located in zone 6, (zero to -10 degrees). The USDA once again updated their map in 2023, designating this area as 6b. But for many area gardeners the question still remains, "What zone does the majority of Kansas City fall into, zone 5 or 6?"
Kansas City has been zone 6 for some time. But many experienced horticulturists and avid gardeners prefer to remain somewhat conservative and plant using zone 5 as their guide, just to be safe. The underlying problem with the current maps is the short term weather data that was used to determine zones. Especially the Arbor Day Foundation. The USDA map uses decades of data over an extremely long period of time.
Complicating things is the fact that recent winter temperatures have come close to pushing our area back into zone 5. For a number of years we have been zone 6.
The real cause of winter plant damage in Kansas City
The issue with winter damage to plants in recent years has not been low temperatures, whether they were in zone 5 or zone 6. The real issue is the sudden shift from warm temperatures to cold temperatures. The plants are not properly hardened off and the cambium layer gets killed. This has happened to weeping cherries and boxwood recently. It appears that we may be in a pattern that has more wide swings in temperature. The bottom line is that it is not the low temperatures that damages plants but the plants inability to cope with widely fluctuating temperature swings.
Cold hardiness maps only show half the picture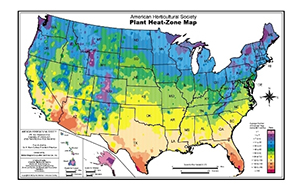 Keep in mind that the cold hardiness maps are only for determining winter survival. They do not take into consideration the effects of summer's heat, drought, rainfall, humidity and soil types — all of which are important for plant survival and growth. There is a heat zone map developed by the American Horticultural Society that helps gardeners know more about summer effects on plants. Unfortunately, few plant labels have a heat zone designation.
Gardeners interested in learning more about the hardiness zone maps may view them on the web.
Do You Have Questions?
Have questions? The Garden Hotline is staffed by trained EMG volunteers and Extension staff who will assist you with questions.
Phone: (913) 715-7050
Email: garden.help@jocogov.org
